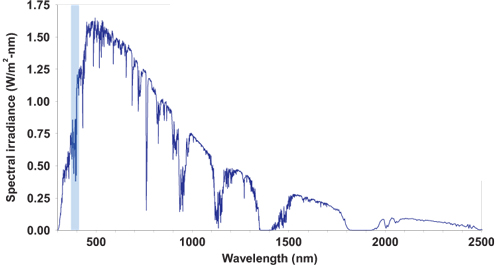
Figure 1: ASTM G173-03 AM1.5G reference spectrum. Shading represents effective response of UCSB device (370–410nm).
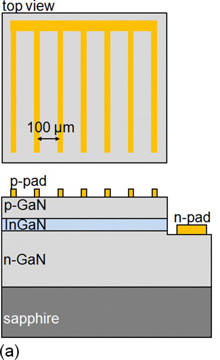 Figure 2: Schematic of UCSB InGaN/GaN solar cell
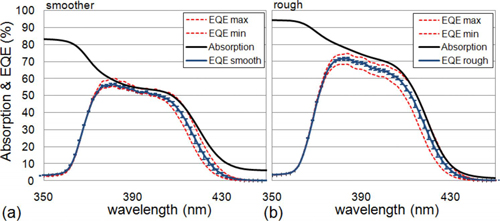
Figure 3: Measured absorption (solid), average (solid with error bars), maximum and minimum (dashed curves) EQE curves for (a) smoother and (b) rough samples. Average EQE and its standard deviation (error bars) were determined from measurements of 12 devices in the same area of the sample where the absorption was measured.
Device | Voc | Jsc | FF | Pmax | EQEpeak | IQEpeak |
V | mA/cm2 | % | mW/cm2 | % | % | |
Smooth | 1.83 | 0.83 | 76.6 | 1.16 | 56 | 97 |
Rough | 1.89 | 1.06 | 78.6 | 1.57 | 72 | 93 |
Table 1: Solar cell performance metrics.
No comments:
Post a Comment